AC72 Polars & Penalties
 A CSN reader & design expert has been following the AC72 Polars used to asses penalties. Analyzing these can give you an idea of the efficiency and speed but also the developments made by the teams if changes on the polars are published. Highest speed recorded while racing was 44knots by TNZ.
Once all foiling downwind my guess is that upwind performance will define this as it seems LR has no visible speed handicap off the wind.
In perspective Artemis was designed to optimize Upwind ‘floating mode’ and now that they are foiling dwnw they can be a threat, the problem will arise for them if TNZ and Oracle start foiling upwind too….! Check below this interesting JNavas Video from yesterday with AR & OR race training. Follow his channel for updates, also comments at SA.
Left Pre and post July 30 Polars, click image to enlage.
Tables can be found at: https://noticeboard.americascup.com/wp-content/uploads/actv/LV13/AC72polar.130714.txt
Table has Deckman format – 5 lines of Windspeeds; Columns v1 / a1 are Upwind Speed/Angle; v4 / a4 are downwind targets.
Notes on the Polars can be found at: https://noticeboard.americascup.com/wp-content/uploads/actv/LV13/PolarNotes.txt
Below some considerations by the same expert: “The penalty line is 2 hull lengths behind the boat – 44metres:
‘The penalty line is moved toward the next mark or center of the penalized yacht at 100% of the universal VMG / VMC based on the wind speed and direction, current, and course to the next mark for 10 seconds, and thereafter at 90% of the universal VMG.’
Penalties converted to Time:
|
TWS, kn
|
5
|
12
|
16
|
20
|
26
|
|
Upw, s
|
9
|
7
|
6
|
5
|
5
|
|
Dn, s
|
8
|
4
|
3
|
3
|
2
|
The penalties aren’t overly sensitive to the actual numbers so it doesn’t really matter if the teams fudged the numbers a bit. Ie: if your actual target downwind speed in is 46kn instead of 44kn, it is a 0.1sec error in penalty.
ACRM will be monitoring the performance
and updating if necessary – so monitoring the polar file can determined if/when it changes.
Attached is a much better looking polar plot. It’s probably not accurate around 160 TWA – the drop off would be steeper and maybe even discontinuous when the wing stalls on the leading edge. In reality the very low angles would have massive hysteresis depending on whether the boat is bearing away and maintaining aero flow, or heading up from a stalled position. There would be the same sort of jumps with foiling/non-foiling.
Surely teams are finding/looking for more innovative ways to display performance data because it is so dynamic – there are another 2 dimensions of BS and foiling to consider.”–


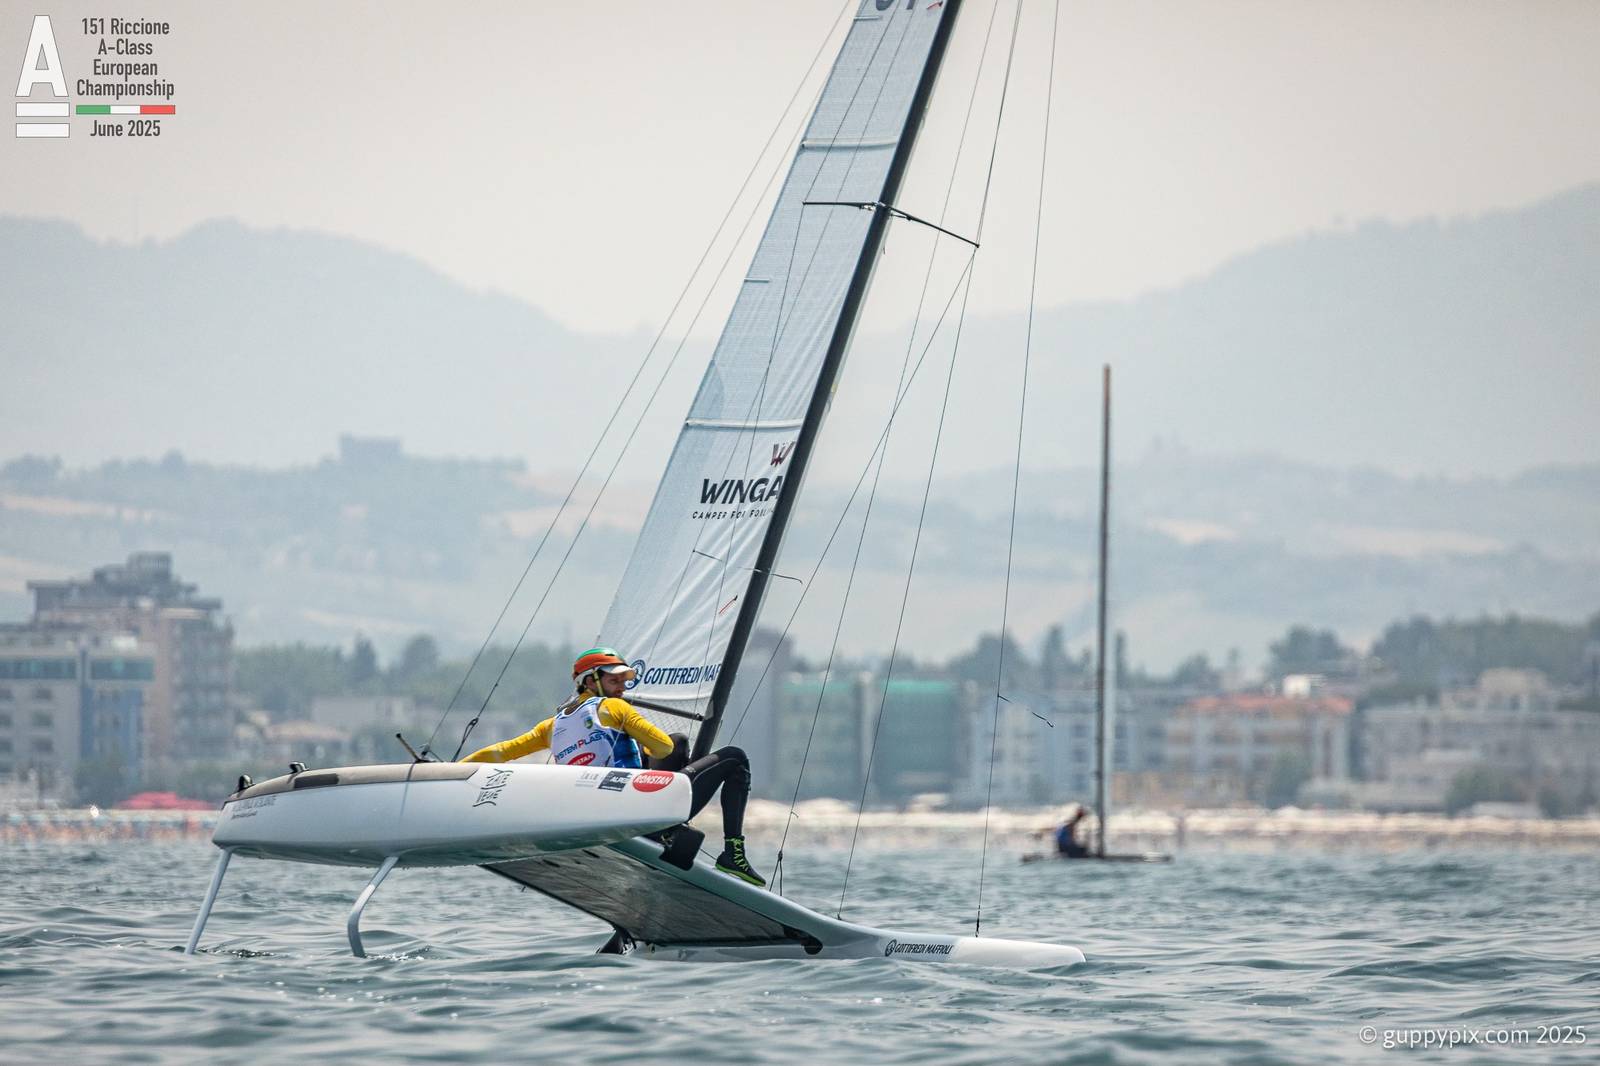

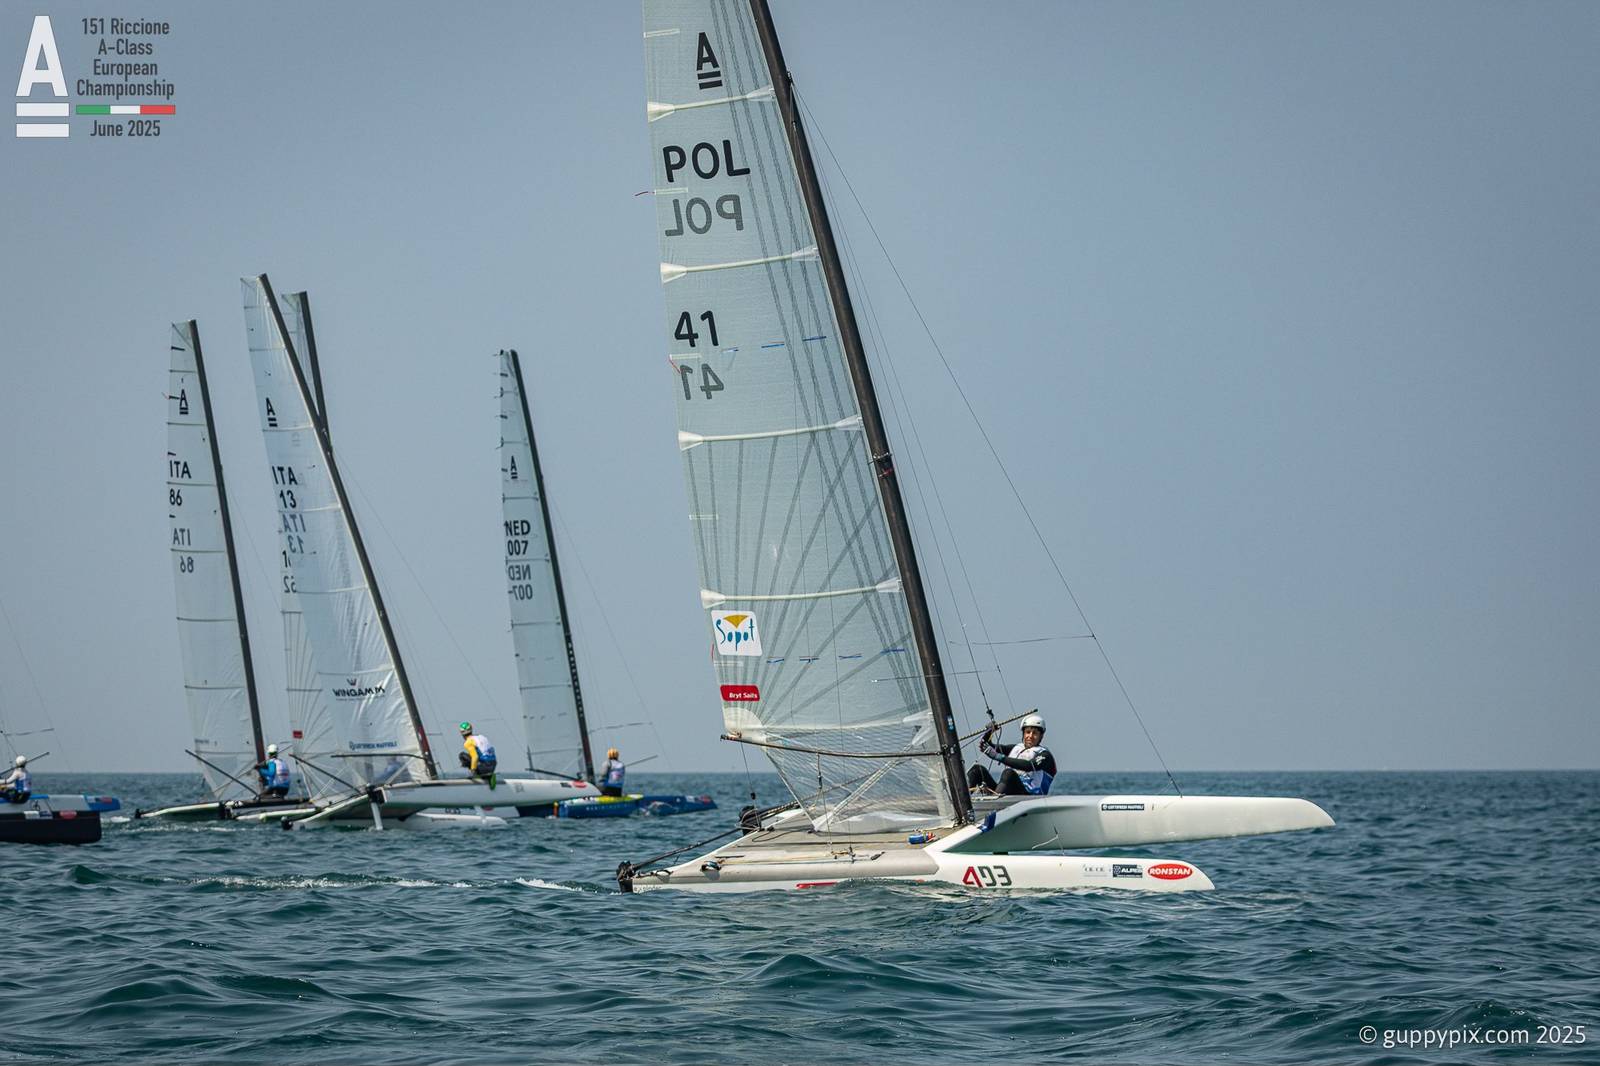
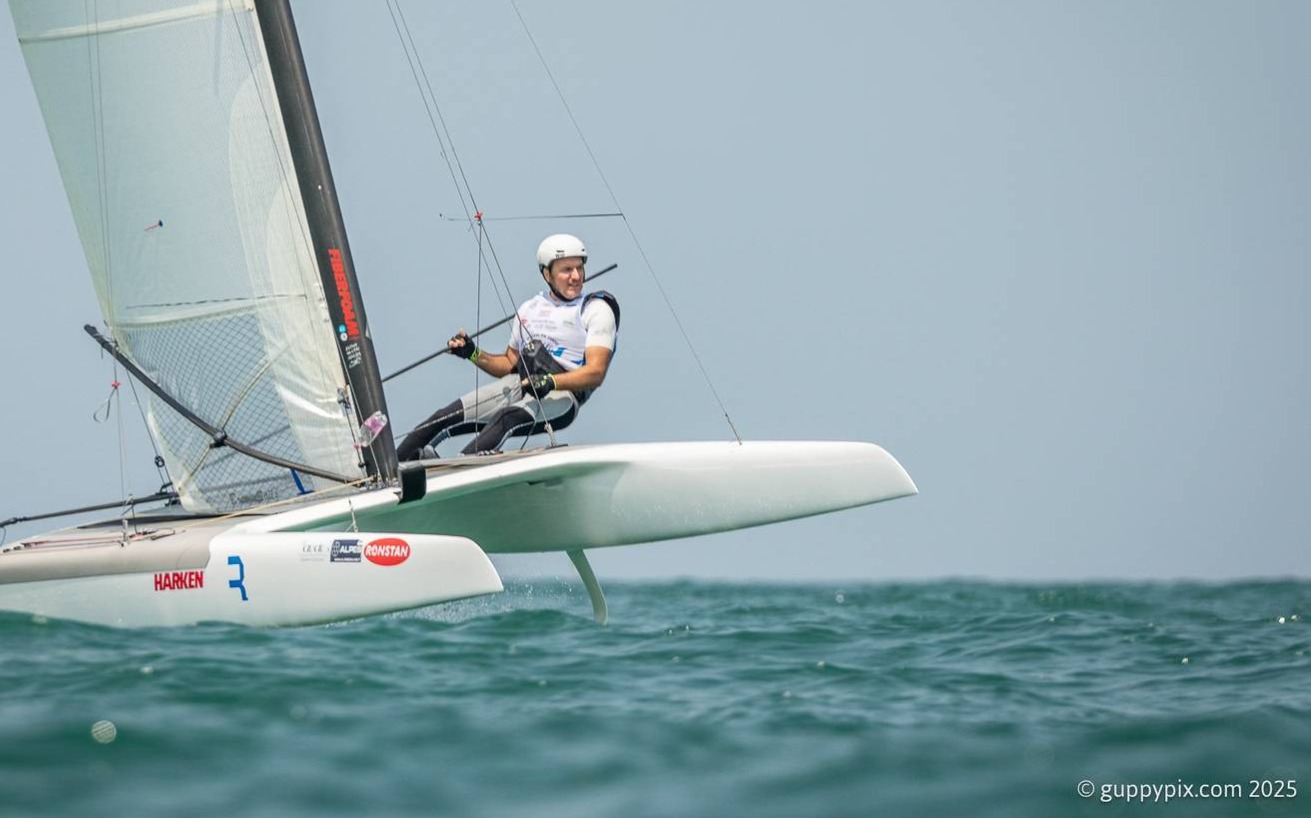


Scotti used his Nikita
Teo di Battista , 3° of Classic using Exploder Ad3 2016 version instead Scheurer .
I just heard that my great sailing friend and former CEO of Hobiecat Europe has passed. May The endless oceans…
...Report was sent by an F18 Sailor, if you want Hobies reported send your own, we'll publish as usual. Cheers.
Looks like in your report the Hobies are not really present. Suggest to rewrite the article.